

We often hear stocks and bonds mentioned together as if they’re pretty much the same thing.
But are they? Not really.
In fact, it might even be that most people understand stocks even better than bonds. After all, relatively few people own bonds individually.
So, what is a bond, and how may it fit in your overall investment portfolio?
Table of Contents
So, What Is a Bond, Exactly?
Bonds are securities representing debt obligations, usually issued by either corporations or governments.
They’re normally issued in denominations of $1,000 and pay interest twice each year. What’s more, the interest rate is fixed for the duration of the bond.
If the bond is held to maturity, the investor will be paid the full face amount of the security.
As an example, if you purchase a bond for $1,000, with an interest rate of 4% and a term of 20 years, you will be paid $40 per year – $20 every 6 months – until the bond is paid in full 20 years later.
Bonds are much like certificates of deposit, except that they are issued by institutions other than banks and have much longer terms. They also lack the FDIC insurance coverage that comes with bank-issued CDs.
Bonds are long-term securities with terms greater than 10 years.
However, investors often lump any type of fixed-income investment into the bonds category.
That can include securities with a term of anywhere from a few months to 30 years.
What Types of Bonds Are There?
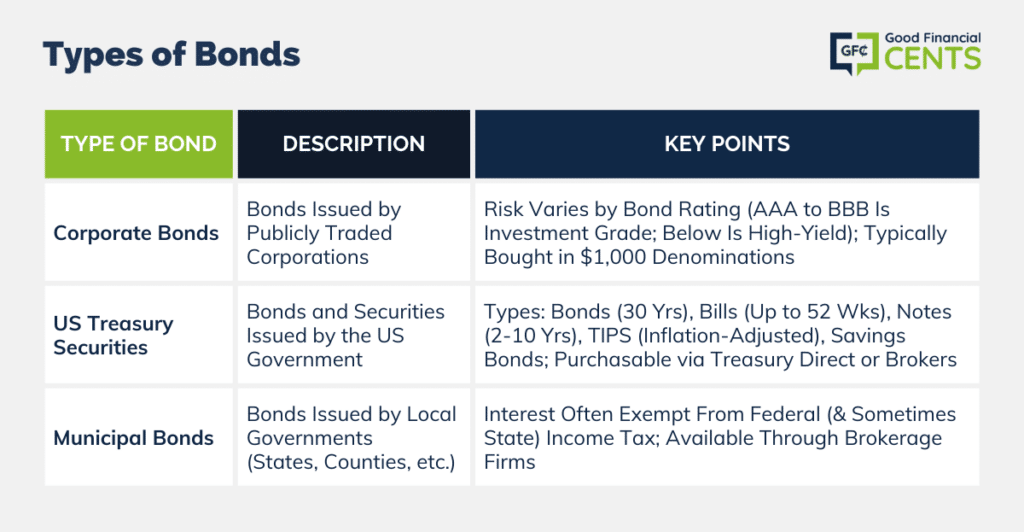
There are 3 primary types of bonds:
1. Corporate
Let’s take a look at each.
Corporate Bonds
These are bonds issued by publicly traded corporations and often listed on public exchanges. They can be used for a variety of business purposes, including paying off old debt, expanding operations, raising extra cash, or even acquiring competitors.
They’re generally considered less safe than US Treasuries and pay a higher rate of interest as a result.
Exactly how much interest they’ll pay will depend upon their bond rating, as issued by large bond rating services, such as Moody’s or Standard & Poor’s.
Bonds with ratings of BBB through AAA are considered the safest and rated as investment grade.
Lower-rated bonds once referred to as “junk bonds,” are now called “high-yield bonds” and pay much higher rates of interest. Naturally, such bonds are also more likely to default and are considered riskier.
Corporate bonds can generally be purchased through investment brokerage firms. They’re typically bought in denominations of $1,000, but you may have to buy a minimum of 10 bonds or $10,000. Both purchase and sale will generally involve a small commission.
US Treasury Securities
US Treasury Securities come in a wide variety of terms. Technically speaking, only one security is actually a bond, which is the US Treasury bond. But just to clear up any confusion, we’ll discuss the various types of US Treasury securities that are available.
- US Treasury Bonds: These are the longest-term treasuries, with a maturity of 30 years. They are available in denominations of as little as $100 and pay interest every six months.
- US Treasury Bills: These are the shortest-term treasuries, with maturities ranging from a few days up to 52 weeks. They can be purchased in denominations of $100 but are bought at a discount. For example, you might purchase a Treasury bill for $99, which you will redeem at maturity for $100. The additional $1 paid represents interest paid on the security.
- US Treasury Notes: Notes have maturities of 2, 3, 5, 7, and 10 years. They pay interest every six months and are available in denominations of $100.
- Treasury Inflation-Protected Securities (TIPS): These are interest-bearing treasuries that also increase your principal based on changes in the consumer price index (CPI). They come with maturities of 5, 10, and 30 years. The interest paid is lower than Treasury securities with comparable terms, but the principal additions are meant to keep the value of the security up with inflation.
- US Savings Bonds: Available as EE and E savings bonds, they are available in denominations of $25 and earn interest for up to 30 years. There is also the I Savings Bond, which, like TIPS, increases the principal value of the security based on changes in the CPI.
Where to Buy US Treasury Securities
All US Treasury Securities can be purchased, held, and redeemed through the US Treasury Department’s web portal, Treasury Direct. They can also be purchased through investment brokerage firms, though there may be a nominal fee for both purchase and sale.
Municipal Bonds
These are bonds issued by local governments, including states, counties, municipalities, and their various agencies.
They have the advantage of not being subject to federal income tax. If you are a resident of the same state where the bonds are issued, the interest will also be free from state income tax.
However, if you live in a different state, the interest will be taxable in your state of residence if it has an income tax.
Municipal bonds can generally be purchased through investment brokerage firms and once again for a small commission on both purchase and sale.
For those looking to get started in bond investing, Worthy Peer Capital is a good place to start.
What Are the Benefits of Bonds?
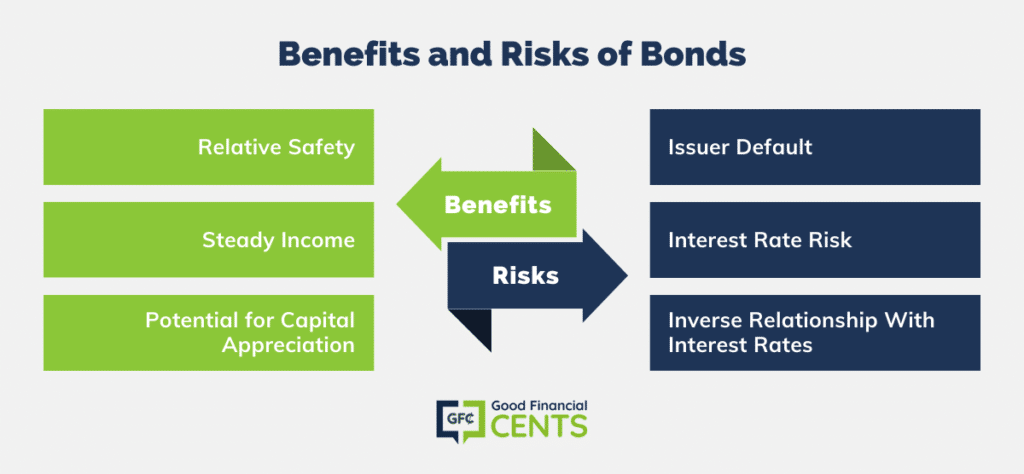
Bonds have two basic benefits, at least compared to stocks.
The first is relative safety. While stock prices fluctuate, bonds are repaid at the full face value if they are held to maturity. This makes them a solid diversification away from stocks.
Holding a certain percentage of your portfolio in bonds can reduce the overall volatility and has been shown to improve long-term investment results.
The second benefit is steady income.
The interest paid on bonds is a contractual obligation. Unlike dividends, which can be either reduced or eliminated by the issuing institution, the interest rate set on a bond upon issue is guaranteed until maturity.
This provides the bondholder with a steady source of income, even while stocks may be fluctuating in value.
There’s a third benefit bonds have in common with stocks, and that’s the potential for capital appreciation. It has to do with changes in interest rates.
Let’s say you purchased $10,000 of a certain bond with a 5% interest rate.
You then sell the bonds and collect a $2,500 capital gain on the transaction.
What Are the Risks of Bonds?
Despite the advantages of holding bonds, they’re not without risks. There are two primary risks.
Issuer Default. This is a bigger concern with corporate bonds. A company can fall on hard times and default on its debts. Not only would you lose the interest income, but the principal as well. There are different ways this can play out. In a corporate bankruptcy situation, you may receive partial value of the bonds.
But in an extreme situation, the bonds may be declared completely worthless.
Since they are issued by the US government, Treasury securities are considered immune from default. Municipal bonds do have a slight possibility of default, but in fact, defaults have been very rare on these securities historically.
Interest Rate Risk. In the last section, we talked about the possibility of bonds providing capital gains if you purchase a bond and then sell it into a market with lower interest rates. But the opposite can happen if interest rates rise.
Let’s reverse the example given earlier. You purchase $10,000 in bonds, paying 4%. Two years later, the prevailing rate on bonds is 5%. You sell the bonds at $8,000, which is the principal value that will produce a 5% return. In the process, you take a $2,000 capital loss.
This is referred to as interest rate risk – the risk that the value of your bonds will fall if interest rates rise.
The major disadvantage of bonds is that they have an inverse relationship with interest rates. Rising rates equal falling values while falling rates equal rising values.
You should also be aware that US Treasury bonds are also subject to interest rate risk, even though the principal value of the bonds is guaranteed at maturity.
What Are Bond Funds?
So far, we’ve been talking about purchasing individual bonds.
But you can also invest in bonds through bond funds. Bonds are sold through funds, just the way stocks are. Each is a portfolio of bonds held in a single investment unit. The fund may hold hundreds of different bond issues and will be run by an investment manager.
It’s important to understand that there is a wide variety of bond funds. In fact, you can choose a fund based on your own investment preferences.
That can include five-year Treasury notes, but it can also include 20-year corporate bonds due to maturity within five years. Investors often choose shorter-term bond funds to minimize or eliminate interest rate risk.
You can also invest in bond funds that hold only non-investment grade bonds (bonds with ratings below BBB). These funds are riskier than the ones that hold higher-quality bonds, but they provide higher interest rate returns.
An investor may take a small position in a high-interest bond fund to increase the overall yield on a larger bond portfolio.
Bond funds offer professional management as well as greater diversification.
However, they typically charge commissions, known as “load fees,” that can range between 1% and 3% of the fund value.
You can invest in bond funds through investment brokers or through large mutual fund companies like Vanguard and Fidelity.
How Much of Your Portfolio Should You Hold in Bonds?
Virtually everyone who invests should have at least some money invested in fixed-income investments, including bonds.
They provide greater stability in an investment portfolio and are particularly valuable during downturns in the stock market. Not only are they more likely to retain their value in a market decline, but they’ll also pay interest income along the way.
But there’s much debate about exactly how much you should hold in bonds. Different factors have to be considered, including your age, your investment time horizon, and your market risk tolerance.
But, there are some formulas that reduce the allocation percentage to a mathematical equation.
One that’s grown popular in recent years is 120 minus your age. For example, If you’re 40 years old, 80% (120 minus 40) of your portfolio should be held in stocks, while 20% should be held in bonds.
If you’re 60, then 60% (120 minus 60) should be held in stocks and the remaining 40% in bonds.
The formula might not be entirely fool-proof, but it at least accounts for your age and investment time horizon.
For example, notice that as you get older, the bond portfolio percentage increases.
This is consistent with what investment managers typically recommend. The closer you get to retirement, the lower your stock exposure should be.
It doesn’t really take risk tolerance into account, but you can use the formula as a starting point and then adjust the allocations based on your own personal tolerance.
Final Thoughts on What Is a Bond
So there, you have a high-altitude view of bonds.
As you can see, bonds are probably more complicated than most people believe. They come in different shapes and sizes and are issued by various entities. Each has its own strengths and limitations.
Armed with just a general understanding of bonds, you should be able to appreciate the need to hold at least some part of your portfolio in them. Most investors don’t hold individual bonds since it’s difficult to adequately diversify.
Bond funds are usually the better choice for small investors, particularly if you’re interested in specialized bonds, like municipal bonds or high-yield bonds.
One final word on bonds…if you’re looking for an asset that’s totally safe, bonds may not qualify.
They are subject to the risks discussed above despite being less risky than stocks.
But if you want complete safety for at least part of your portfolio, then you’ll need to look at CDs, money markets, and high-yield savings accounts.