
Once you’ve made the decision to buy a house, the most important question will be how much house can I afford? Since there are so many factors involved in that question, the answer will be found in a multi-step process.
Though we’re going to go through the many steps necessary to learn how much house you can afford, you can also take advantage of our home affordability calculator to speed the process.
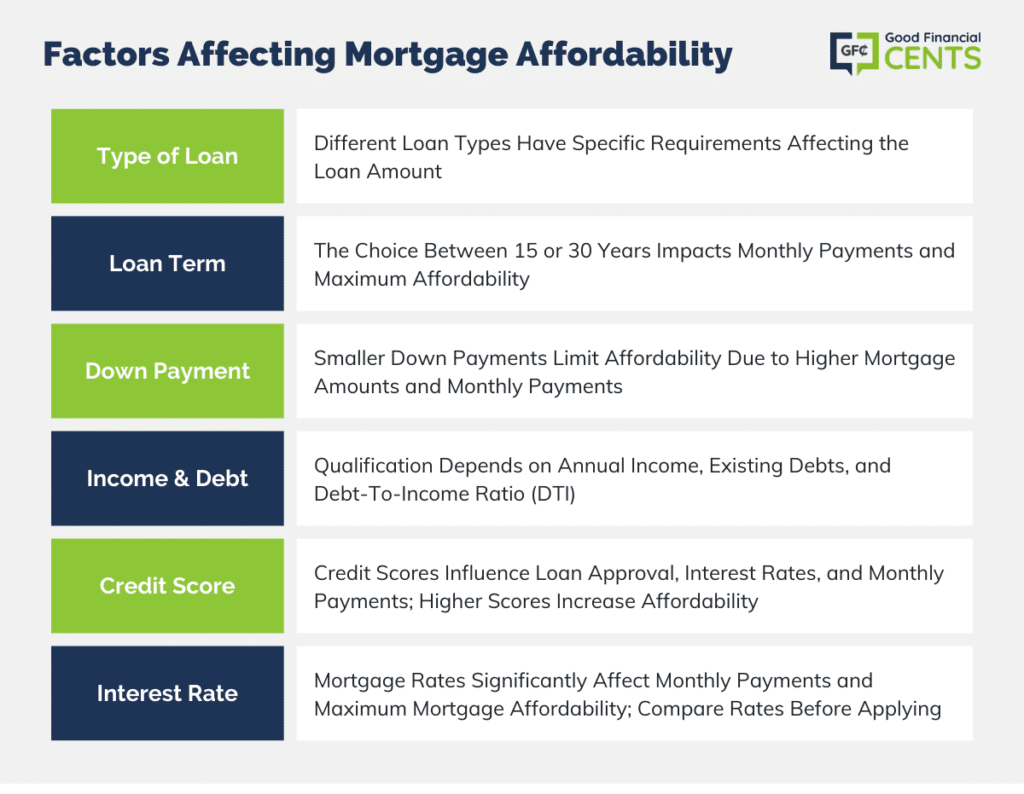
What Affects How Much House Can I Afford?
Getting a mortgage is unique to each individual because it’s based on several factors:
Type of Loan
There are different types of mortgage loans, and each has its own specific requirements. For example, you may choose to apply for a conventional, Jumbo, FHA, VA, or USDA mortgage. Each is likely to result in a slightly different loan amount.
The Loan Term
You’ll need to do an analysis of the 15 vs 30-year mortgage. With its longer term, a 30-year mortgage will result in a lower monthly payment. That will enable you to qualify for a larger loan amount, and thus a higher-priced home — though you’ll be paying back the mortgage for longer.
Down Payment
The smaller the down payment, the higher the mortgage amount, and the higher the monthly payment, the less house you’ll be able to afford.
For example, a VA mortgage requires no down payment at all. But the 100% financing feature will produce a high monthly payment. By contrast, taking a conventional or Jumbo loan with a 20% down payment will enable you to buy more houses due to its lower house payment.
Income, Debt and Debt-to-Income Ratio (DTI Ratio)
Your ability to qualify for a mortgage will depend on the combination of your annual income and debt. Not only will you need sufficient income to carry the new house payment, but also any existing debt you will have after closing.
Your debt burden will include any student loan payments, car loans, and credit card debt.
This is calculated using what’s known as the DTI. The formula takes the new house payment, plus other monthly debt payments, and divides the total by your stable gross monthly income.
Though the “ideal” DTI is no higher than 36%, most lenders will go up to 43%. And if you have strong compensating factors, like a large down payment and excellent credit, a DTI of 50% may be allowed.
Credit Score
The minimum credit score for each loan type is generally as follows:
- Conventional – 620
- Jumbo – 660 or higher
- FHA – 580, but some lenders will go as low as 500 with a 10% down payment
- VA loans – no minimum credit score specified, though individual lenders may have their own requirements
It’s important to understand that not only will your credit score determine your loan approval, but it will also affect your interest rate. The higher your credit score, the lower the interest rate.
This will translate into a lower monthly payment, and into the ability to qualify for a higher mortgage amount.
If your credit score is below those listed above, you may want to enlist the services of one of the best credit repair companies. That may offer you the fastest way to improve your score.
Interest Rate
The interest rate you’ll pay on your mortgage is one of the primary factors in your monthly payment.
As an example, let’s look at a $300,000 mortgage using two different interest rates. The first is a 4% rate for someone with a credit score well above 700; the second is 5.5% for a borrower with a credit score of 630.
- A 30-year mortgage at 4% will result in a payment of $1,761.
- A 30-year mortgage at 5.5% will result in a payment of $2,032.
The difference between the two payments is $271 per month. That means you’ll qualify for a larger mortgage at 4% than you will at 5.5%.
This is just as important when it comes to refinancing your current mortgage into a new one. When that happens, be ready to investigate the best mortgage refinance companies.
How to Calculate Your Down Payment
The amount of the down payment you make will have a major impact on your loan amount. The more you put down, the lower your loan amount and your monthly payment.
It will help to know what the minimum down payment requirements are based on the type of loan you are applying for.
The minimum down payment requirements for each of the four primary mortgage types are as follows:
- Conventional: 5% but can be as low as 3% for first-time homebuyers and for lower-income borrowers
- FHA: 3.5%
- VA: 0% (100% financing)
- Jumbo Loans: 10% or higher, depending upon the purchase price of the property, or the property value for refinancing
The down payment percentages above are only the minimum requirement for each loan type.
Strategies for Saving for a Down Payment
How to save for a house down payment is one of the biggest issues for would-be homebuyers. Since most mortgage loan types will require a down payment, it’s important to have a strategy to at least reach the minimum requirement.
Here are five general strategies to implement to help you reach your down payment goal:
1. Set Your Down Payment Target: This will require knowing how much home you can afford, the loan amount you’ll qualify for, and the cash you’ll need at the closing table.
2. Set Up a Budget: Saving money for any goal will likely require gradually reducing expenses to find cash to save.
3. Open a Dedicated Savings Account: This is a mission-critical step. Setting up a separate account specifically for your down payment will not only help you track exactly how much you have saved, but it will also avoid mixing your dedicated home-buying funds with other savings intended for other purposes.
4. Automate Your Savings: The best way to do this is through payroll deductions directly into your dedicated savings account. That will enable you to save money without any additional effort on your part.
5. Bank Windfalls: By saving your tax refund, bonus income, or other windfalls, you’ll reach your down payment target even faster.
You should also know that it may be possible to make a down payment using a gift from a family member. Check with the mortgage lender you’re working with to see what the specific requirements are based on the loan program you’re using.
Why Shopping for a Lender Is So Important
This may be the most underrated part of the homeownership experience. You may assume all lenders charge essentially the same rates and closing costs, but that isn’t true, especially when you factor in the different types of mortgages, from FHA loans to conventional loans.
In the search for the best mortgage rates, you may come across a lender with a lower interest rate than anyone else.
But that should raise a red flag, alerting you of two possibilities:
1. The Lender Is Quoting a “Floating Rate.” That is, it may be the rate is available today, but not 30 or 60 days from now when you plan to close on the home. Always inquire what the rate will be if you lock it today for your intended closing date.
2. The Lender May Be Advertising a Very Low Interest Rate, but One With Very High Closing Costs. That’s most likely because the rate will have been “bought down” through the payment of discount points.
Those points will raise your closing costs, making the loan more expensive than those of the lender’s competitors.
In conducting your search for financing, be sure to concentrate on the best mortgage lenders. Those are the lenders that have either been recommended to you or are among the major lenders in your area or the industry in general.
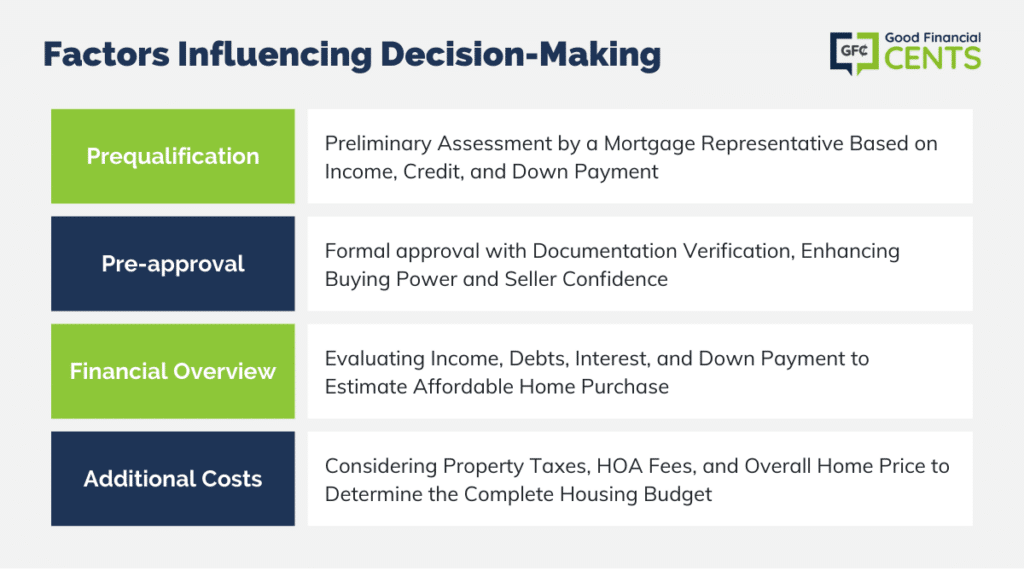
Factors That Influence Your Decision-Making
The only way to know your housing budget for certain is to meet with a mortgage representative and get prequalified. The lender will request your employment and income information and may even run a credit check.
Armed with that information, as well as the amount you intend to put down on the home, the lender will be able to give you a fairly accurate house price.
If you’re planning to buy a home in the next 60 to 90 days, you may even want to get pre-approved.
A pre-approval is different from a prequalification because the lender will actually request and obtain documentation supporting your income, assets, and credit.
Based on that information, they’ll issue a formal approval, subject only to the selection of a property, property appraisal, and routine closing conditions.
Pre-approval upfront will not only provide assurance that you’ll be qualified for the loan you need, but it will also help when you submit offers on houses you’re interested in.
Property sellers love a pre-approved borrower because it removes the risk of inability to get financing. The preapproval may even help you to get a better price.
In this guide, we’ve used a similar methodology to mortgage lenders in assessing home affordability.
We spelled out the need to consider your overall financial situation, including income, non-housing debts, the interest you’ll pay on the new loan, and the down payment in calculating approximately how much house you can afford.
Final Thoughts on How Much House You Can Afford
As you can see, there are many moving parts in determining how much house you can afford. That’s why we’ve spelled out all the factors involved in coming up with a reliable estimate of what you can afford.
Just remember that your current budget isn’t necessarily the upper limit. As discussed in the previous section, there are steps you can take that will help you to qualify for a higher-priced home.